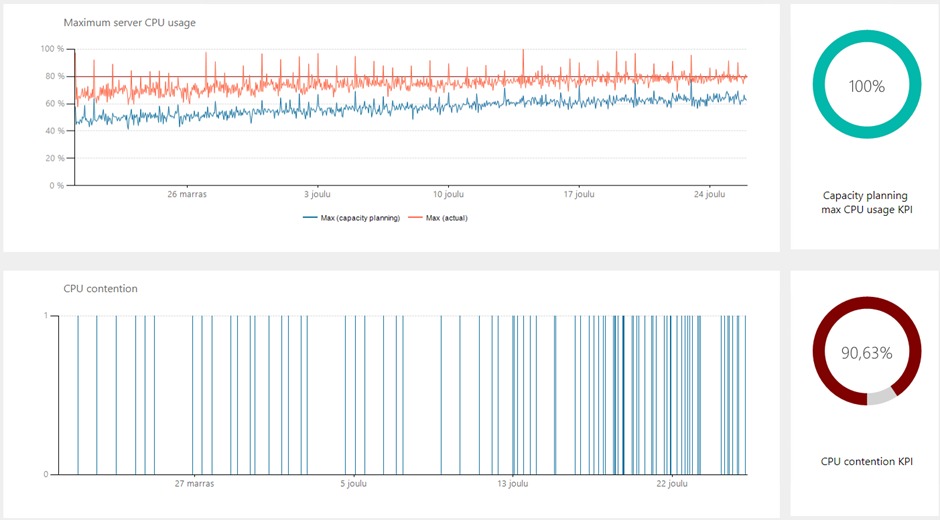
What is CPU contention
CPU contention is a seriously taken phenomenon in a server, where multiple threads or processes are competing for being processed simultaneously. When the level of CPU contention is high, CPU processing speed may not be enough to handle all the requests at the same time. This can lead into increased response times, server operating slowdowns or even degradation of the overall system availability. Just imagine if such a server is taking care of critical business workloads.
In the database world, CPU contention is often seen in under-provisioned OLTP servers or on servers which have great volatility in CPU processing needs on a seasonal basis. This is because OLTP servers are often multi-threaded and multi-tasked, where various tasks are competing on same CPU resources simultaneously. So, when there is a service peak, there will be potentially some (or a lot of) CPU contention.
To be able to eliminate or at least alleviate the beforementioned problems, software developers, sysadmins and DBAs have different kinds of strategies to avoid this phenomenon. The most expensive thing to do is to upgrade the system hardware, especially on physical servers (add more CPU sockets, renew server hardware). Sometimes this is the only option, though. Also, the overall data platform architecture and data modelling play an important role in fighting against CPU contention. This results into better scalability and more efficient resource usage. To be more specific, in the SQL Server world, DBAs often optimize instance level configurations such as max degree of parallelism and cost threshold for parallelism, not to forget optimal indexing strategies and writing efficient code. Developers may focus more into task scheduling and prioritization activities.
How to identify CPU contention
To identify CPU contention, you need to monitor server performance telemetry data to detect signs of high CPU utilization and potential CPU contention. This is a list of eight tool categories that will help you in diagnosing and fixing SQL Server CPU contention issues:
Resource Monitoring / Performance Optimization Tools: Utilize system monitoring tools such as Windows Task Manager or SQL Governor software to identify CPU utilization over time. Windows Task Manager provides real-time or historical data on CPU utilization, whereas SQL Governor software calculates CPU contention patterns, alerts on these issues in real time, and visualizes them as comprehensive charts and KPIs for capacity planning purposes.
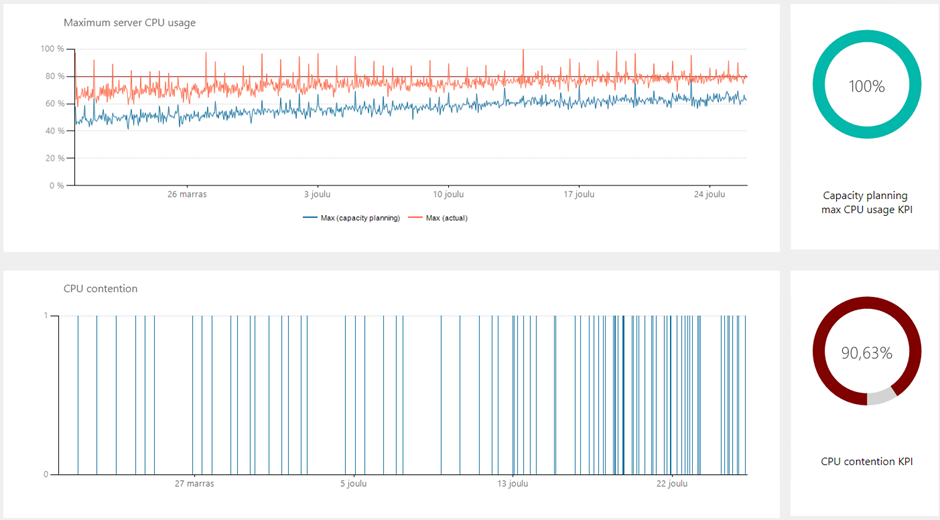
Performance Counters: You can use Windows Performance Monitor aka "PerfMon" to track CPU-related performance counters such as CPU utilization, queue lengths, context switching and interrupts. Any deviations in these counters can indicate CPU contention.
Profiling Tools: You can use CPU profiling tools like Windows Performance Toolkit (WPT) to analyze CPU usage in more detail.
Tracing and Logging: Logging and tracing mechanisms in your applications or operating system assist in capturing CPU related events. These events are such as CPU wait times, context switching and thread scheduling.
Benchmarking: You can also apply benchmark tests on your system under different levels of CPU utilization workloads to get an idea of the CPU limits of your server. In SQL Governor software you can combine performance metrics and capacity planning algorithms and apply your own resource utilization scenarios into overall calculations.
Server Alerts: In SQL Governor software your server monitoring alerts notify you when CPU utilization exceeds or is forecasting to exceed certain thresholds or when CPU contention is detected. This proactive approach can help you identify and address CPU contention issues in a timely manner.
SQL Server Profiling tools: You can profile your applications using tools like profilers or lightweight query trace in SQL Governor software to identify T-SQL stored procedures, functions, batches, and queries that consume CPU resources excessively. By optimizing the code, a DBA can help alleviate CPU contention and improve overall system performance.
SQL Server Diagnostics tools: With SQL Governor software you can diagnose SQL Server wait statistics and blocking statements from a CPU perspective. In addition, you can diagnose database indexing issues such as missing, unused, and fragmented indexes, which can hurt CPU performance big time.
How to calculate CPU contention
As mentioned, CPU contention is related to multiple processes or threads competing for CPU resources simultaneously. While there isn't a direct formula to calculate CPU contention in all scenarios, you can use various metrics and observations to measure the level of CPU contention:
- On a physical server, if the average CPU workload is over 80% and the average CPU queue is two times or more the count of logical CPU cores simultaneously for 5 consecutive minutes or more. On a virtual server, the CPU queue limit is typically a bit higher (three times or more the count of logical CPU cores).
- You can track the number of context switches, which occur when the CPU switches from executing one process or thread to another. A high rate of context switches can indicate CPU contention, as the CPU is frequently switching between tasks, potentially causing overhead and slowdowns. High CXPACKET waits in SQL Server, especially from 2016 SP2 on, may refer to a context switching / CPU contention issue.
- A high number of CPU-bound interrupts can indicate that the CPU is spending significant time servicing hardware requests. This reduces available processing time for other tasks.
- Analyzing thread wait times or thread contention metrics helps you understand how long threads are waiting for CPU resources. Prolonged wait times suggest CPU contention.
- Assess the overall performance of the system. If you observe degradation in application responsiveness, increased response times, or decreased throughput, it could be indicative of CPU contention.
CPU contention and capacity planning
CPU contention should always be avoided in SQL Server capacity planning. That's why it is important to make a SQL Server health assessment before you start to do any capacity planning. This is especially the case with crowded / busy SQL Servers: You do not want to try to right-size or consolidate your SQL Server when there is already CPU contention, because then it is harder to estimate needed extra CPU capacity – and something is already wrong on your existing SQL Server. You want to keep – or often even improve – your crucial SLAs.
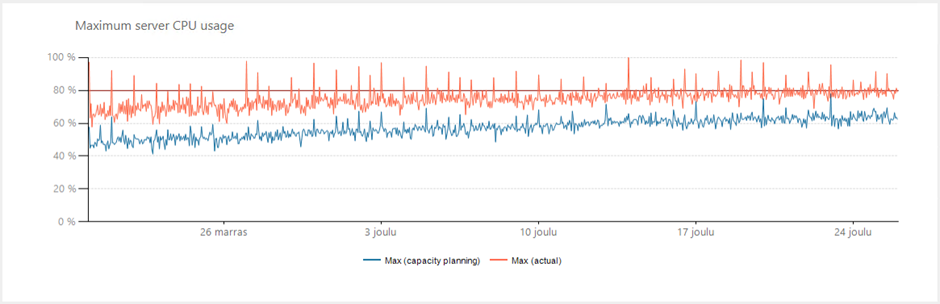
By using the right tools such as SQL Governor, you can identify CPU contention. My recommendation is to fix the issue first and then do the capacity planning. What comes to maximum CPU usage in capacity planning, it is safe to interpolate telemetry data aggregated from one-minute intervals into running five-minute intervals for each hour. This way you don't need as much CPU processing power as you thought you would when looking at one-minute telemetry data on your CPU. This is because the average of one-minute maximums over consecutive 5 minutes is the best representative of any five-minute CPU usage cycle within the hour; furthermore, the highest consecutive running five-minute cycle should be a representative of that given hour in capacity planning:
Summary
Never underestimate the negative impact of CPU contention: it can seriously hurt your SQL Server performance in just 5 minutes. To avoid this, whether you are a sysadmin or DBA, consider using proper software such as SQL Governor to indicate it as early as possible.

Jani K. Savolainen
Founder & CTO, SQL Governor